
THE EFFECT OF FIXED SPEED CAMERAS ON ROAD SAFETY
Abstract
Published 09/June/2014
Objective:
- To evaluate the effect of fixed (Gatso-type) speed cameras on the number and severity of collisions at the sites where they are installed.
Included installations:
- Two groups of sites are evaluated:
- All fixed speed camera sites in the Thames Valley area (covering Oxfordshire, Buckinghamshire and Berkshire) that were active at the start of 2009, a total of 359 speed cameras within 212 sites.
- The subset of the 74 most recent of those sites.
Data:
- Analysis is based on collision data recorded by Thames Valley Police in STATS19 and uses the database of collisions at speed camera sites created and verified by TVSRP (Thames Valley Safer Roads Partnership).
Study design:
- The FTP (Four Time Periods) method was used to fully account for RTM (regression to the mean) effects.
- To compensate for the effects of general influences (or “trend”), analysis used relative collision rates.
- At sites where the necessary data was available (the 74 most recent fixed speed camera sites):
- Three years after installation was compared to a three year baseline period before.
- The effect of RTM was measured.
- Collision rates before and after installation were compared having fully excluded all RTM effects.
- At all 212 fixed speed camera sites (where part of the FTP method was used):
- Collision rates before and after installation were compared having fully excluded all RTM effects.
Final results:
At 212 sites after fixed speed cameras were installed, compensated for general influences and not including any RTM effects or seasonal bias, there was:
- a 38% increase in fatal collisions.
- a 16% increase in KSI collisions.
- a 0% change in all collisions.
Conclusions:
- Reducing vehicle speeds using fixed speed cameras has no impact in improving road safety.
- Fixed speed cameras do not save lives and do not prevent serious injuries.
- Fixed speed cameras are not demonstrated to have reduced the number of collisions.
Recommendations:
- Speed cameras should only be operated within scientific trials known as Randomised Controlled Trials.
- Increases in fatal and KSI collisions at fixed speed camera sites should be independently investigated.
Contents:
9.1 Terms.
9.2 Introduction.
9.3 Factors at speed camera sites.
9.4 Data.
9.5 Method to compensate for general influences.
9.6 The FTP method.
9.7 The 74 most recent fixed speed camera sites.
9.8 All 212 fixed speed camera sites.
9.9 Results.
9.10 Conclusions.
9.11 Recommendations.
9.12 Acknowledgements, references and supplementary information.

9.1 Terms:
Collisions: Road traffic accidents recorded by Police in STATS19.
KSI: Killed or Seriously Injured. People recorded as suffering fatal or serious injuries in collisions.
Mean: The normal or expected value of a random variable (ie not the mean average).
RTM: Regression to the mean as a result of the site-selection process.
FTP: Four Time Periods. The FTP method is used to measure and fully exclude the RTM effect.
SSP: Site Selection Period. The period of time during which the collision rate influenced site selection.
9.2 Introduction:
Authorities in the Thames Valley area have been at the forefront of automated speed enforcement in Britain. They were among the first to install fixed (Gatso-type) speed cameras in 1993 and, within 10 years, had 212 fixed speed camera sites. From 2002 onwards, mobile speed camera operations were substantially increased maintaining Thames Valley as one of the areas with the highest concentration of speed camera sites in the country (1a).
To assess the effect of speed cameras, the government’s two year pilot evaluation examined collision rates at speed camera sites in eight pilot areas and found that collisions of all severities had reduced significantly. Initially it was suggested that these reductions had been caused by the speed cameras (1b) but subsequent research estimated that substantial reductions would have occurred anyway, without the speed cameras, largely due to the effect of RTM (2). As the accuracy of analysis has improved, RTM has been found to be such a significant factor at speed camera sites that this has brought into question whether speed cameras do produce any road safety benefits at all (3).
It is becoming increasingly apparent that the estimates of RTM in official reports have not been sufficiently accurate. RTM is actually a very simple effect which occurs because speed camera sites are often selected following an unusually high collision rate that would therefore tend to drop back to the usual rate afterwards, whether or not speed cameras had been deployed. At the 74 most recent sites where the required data was available, the FTP method was used to both measure the RTM effect and fully exclude the RTM effect from results. At all 212 sites, the relevant part of the FTP method was used to produce results that include the effect of all of the fixed speed cameras, but without including any of the RTM effect.
The final results are the changes that occurred at all 212 sites after fixed speed cameras were installed, compensated for general influences and without any RTM effects. These results should therefore represent the effects of fixed speed cameras more accurately than has been achieved in official reports.
9.3 Factors at speed camera sites:
Collision rates at each speed camera site might be influenced by several factors, including:
- The speed cameras (the effect under evaluation).
- Co-intervention (other interventions around the same time).
- Diversion of traffic (to avoid speed cameras).
- Random variation.
- General influences (effect often referred to as “trend”).
- RTM (regression to the mean) (the “return towards normal” following site selection).
In order to evaluate speed cameras, their effect must be separated from the effects of the other factors.
It is generally not possible to separate the first three factors, and certainly not possible in Thames Valley. Most of the fixed speed cameras within Thames Valley were installed between 1993 and 1998 (before national guidelines were drawn up) at a time when it was common practice to identify collision hot-spots and install several safety interventions, one of which might be a speed camera. No records were kept of which speed camera sites had other interventions, or what those interventions were. Any effect of traffic diverting to avoid speed cameras cannot be separated either as there was little or no collection of traffic flow data that could identify the level of collision migration away from the speed camera sites.
Random variation can be a significant factor where there are low quantities of data (such as at individual sites) therefore analysis needs to be performed on groups of sites. Due to the process that was used to select the fixed speed camera sites in Thames Valley (long SSP and then short delay before installation), the periods before installation that were outside the SSP were short. Although this limited the quantity of data available during that period, the evidence suggests that there was a sufficient number of sites to reduce the effect of random variation to an acceptable level.
The effects of general influences (such as changes in vehicle design, traffic volume, Police reporting practices, cost of fuel, etc) are spread across whole areas therefore their effect at speed camera sites can be compensated for by calculating the proportion of collisions at speed camera sites relative to the whole area. When relative collision rates at sites during different time periods are compared, the results should not include the effects of changes in general influences.
RTM is potentially the largest effect at sites for all types of interventions that might affect road safety, including speed cameras. This report uses the FTP (Four Time Periods) method to measure and fully exclude the RTM effect.
The final results are the changes in collision rates at all 212 sites after fixed speed cameras were installed, compensated for the effects of general influences and excluding the effect of RTM. These changes occurred, therefore, as a result of the combined effect of the fixed speed cameras, co-intervention and diversion of traffic.
9.4 Data:
This report is based on collision data recorded by Thames Valley Police in STATS19. Following preliminary research for this report, TVSRP (Thames Valley Safer Roads Partnership) discovered that many collisions during the 1990’s had been recorded with incorrect grid reference data. TVSRP therefore undertook a “very extensive data cleansing exercise” to find the errors and, using the description, enter the correct grid reference data (4). TVSRP then produced a database of verified collision data at all speed camera sites within Thames Valley and this report is based on the new verified database (5).
There are 212 fixed speed camera sites in the database that were active at the start of 2009 and these are the sites evaluated in this report. The subset of the 74 most recent sites are also evaluated.
9.5 Method to compensate for general influences:
General influences in road safety should affect collision rates across the whole Thames Valley area and collision rates at speed camera sites should be affected in proportion. General influences at sites can therefore be compensated for by calculating relative collision rates at the sites. This was done by taking each item of collision data at each speed camera site in the first (TVSRP) database, dividing by the number of collisions of the same severity that had occurred in the same calendar year across the whole Thames Valley area, and then multiplying by 100. The results were entered into a second database. By comparing relative collision rates in the second database at sites during different time periods, general influences are automatically compensated for.
Note: In 1999, Thames Valley Police changed the severity of injury classified as serious and this therefore affected the number of collisions recorded as KSI all across Thames Valley, including at speed camera sites. Changes in Police reporting practices, such as this, are one of the general influences compensated for by analysing relative collision rates at sites (6).
9.6 The FTP method:
The FTP (Four Time Periods) method splits data at speed camera sites into four consecutive time periods:
- PreSSP The period of time before the SSP during which the collision rate did not influence site selection.
- SSP (Site Selection Period) The period of time during which the collision rate influenced site selection.
- ASBiC (After SSP but Before Intervention Commenced) The time taken to get the speed camera installed.
- Speed camera in operation The period of time after the speed camera was installed.
The SSP is the only period during which the site-selection process could have resulted in a collision rate that was different to the mean therefore collisions during all other periods should have occurred at around their mean rate. The mean collision rate without speed cameras can therefore be established from the data within the PreSSP and ASBiC periods.
The date each speed camera was installed in Thames Valley is known but the start and end of the SSPs were not recorded. This means that, to find out when the PreSSP and ASBiC periods were, the SSP has to be identified from the data. This is the most critical step in the FTP method because RTM effects can only be fully excluded if the SSP is correctly identified.
By analysing data before installation during different time periods, the SSP for fixed speed camera sites in Thames Valley was identified to have been a duration of 5.5 years, ending 0.5 years before the speed cameras were installed. Most of the sites were selected before 1999, at a time when it was common practice to use 5 year SSPs, and the fixed speed cameras were installed from six months to around a year after the end of the SSP. The SSP for the group of sites being 5.5 years is consistent with each site having an SSP of up to 5 years, along with a 0.5 year difference in ASBiC periods.
Data and analysis to identify the SSP for fixed speed camera sites is provided in a spreadsheet (7).
9.7 The 74 most recent fixed speed camera sites:
The SSP for many fixed speed camera sites started before the earliest data in the database therefore data during the PreSSP was not available for all of the 212 sites. One year of data was available during the PreSSP at the 74 most recent sites and these are the sites analysed using the full FTP method (8).
Figure 9.1 shows the proportion of KSI collisions (relative to the whole Thames Valley area) that occurred at the 74 most recent sites. Data is displayed in six month periods for seven years before speed cameras, and then fixed speed cameras were installed within each site within the first month of period 1 (data from table 9.6 (9)). The four time periods were identified as:
- PreSSP (periods -12 and -13).
- SSP (periods -11 to -1).
- ASBiC (period 0).
- After fixed speed cameras installed (periods 1 to 12).
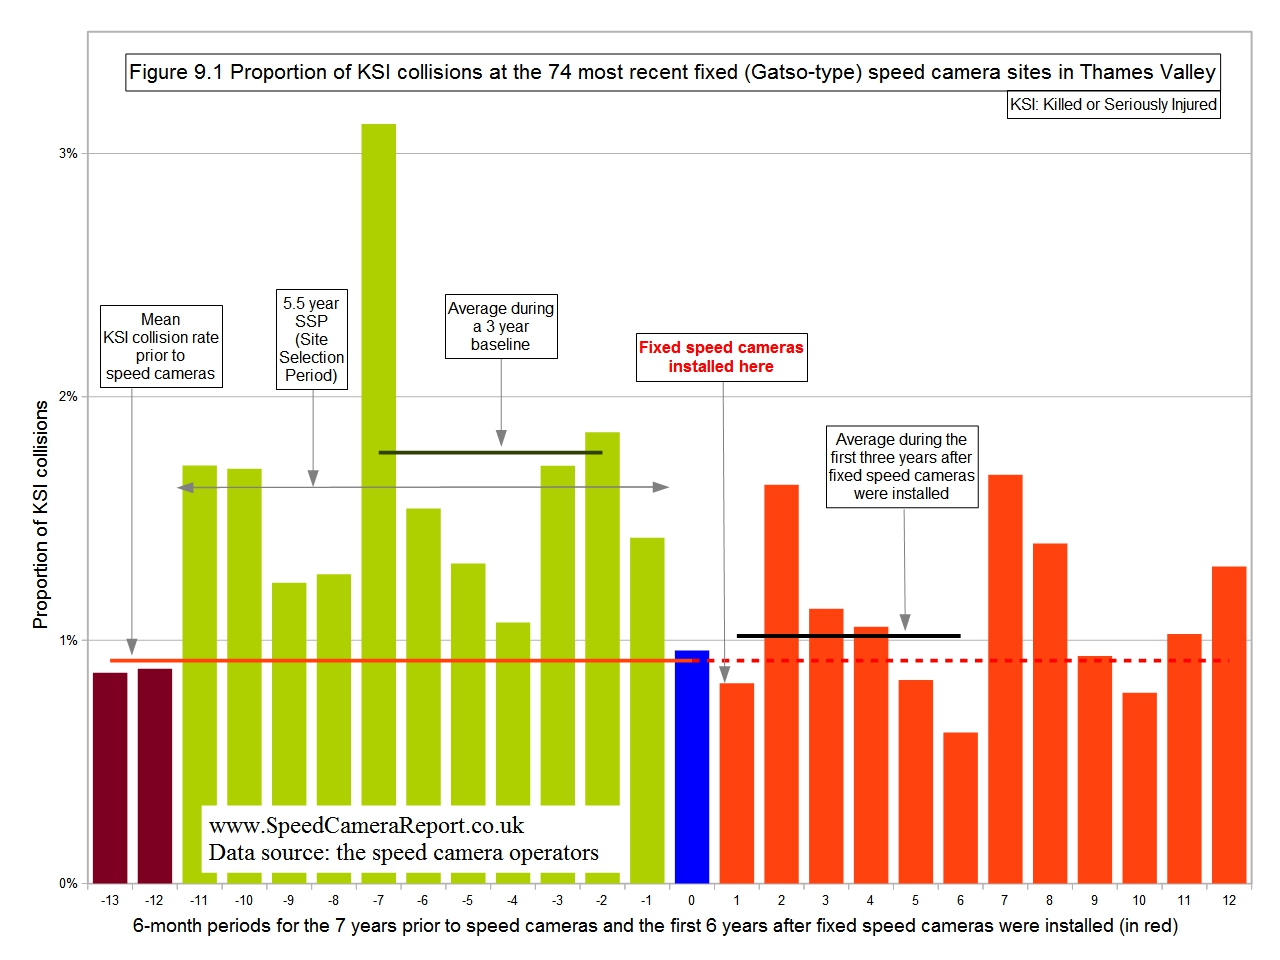
The effect of the site-selection process can clearly be observed in Figure 9.1. KSI collision rates during the PreSSP and ASBiC periods were similar, as would be expected if these were outside the SSP. KSI collision rates were higher during every six-month period within the SSP than during either the ASBiC or PreSSP, as would be expected if these had been the KSI collisions that had influenced the selection of these sites. These observations, along with other evidence (7), confirm both that the SSP has been correctly identified and that the KSI collision rates during the PreSSP and ASBiC periods do represent the mean rate at these sites.
The mean KSI collision rate before speed cameras is displayed and labelled (red line) and this is the rate expected to have continued had speed cameras not been installed (red dotted line).
Official reports often compare three years after installation, to a three year baseline period before. The average KSI collision rates during each of these two periods are displayed and labeled and a large reduction in KSI collisions is observed. The entire reduction, though, had already occurred six months before the speed cameras were installed. In fact, the mean KSI collision rate was lower without any speed cameras, than it was with speed cameras.
9.8 All 212 fixed speed camera sites:
The TVSRP database has three and a quarter years of data before installation at these sites, and six years of data after. This data is displayed in three month periods in Figure 9.2 (all collisions), Figure 9.3 (KSI collisions) and Figure 9.4 (fatal collisions). Fixed speed cameras were installed within each site within the first month of period 1.
The database did not contain data during the PreSSP for every site therefore the three time periods for which data was available for all 212 sites were:
- SSP (periods -12 to -2).
- ASBiC (periods -1 and 0).
- After fixed speed cameras installed (periods 1 to 24).
The ASBiC period only included two seasons (half a year) therefore, to prevent a seasonal bias in the final results, only the same two seasons are considered during the period after fixed speed cameras were installed.
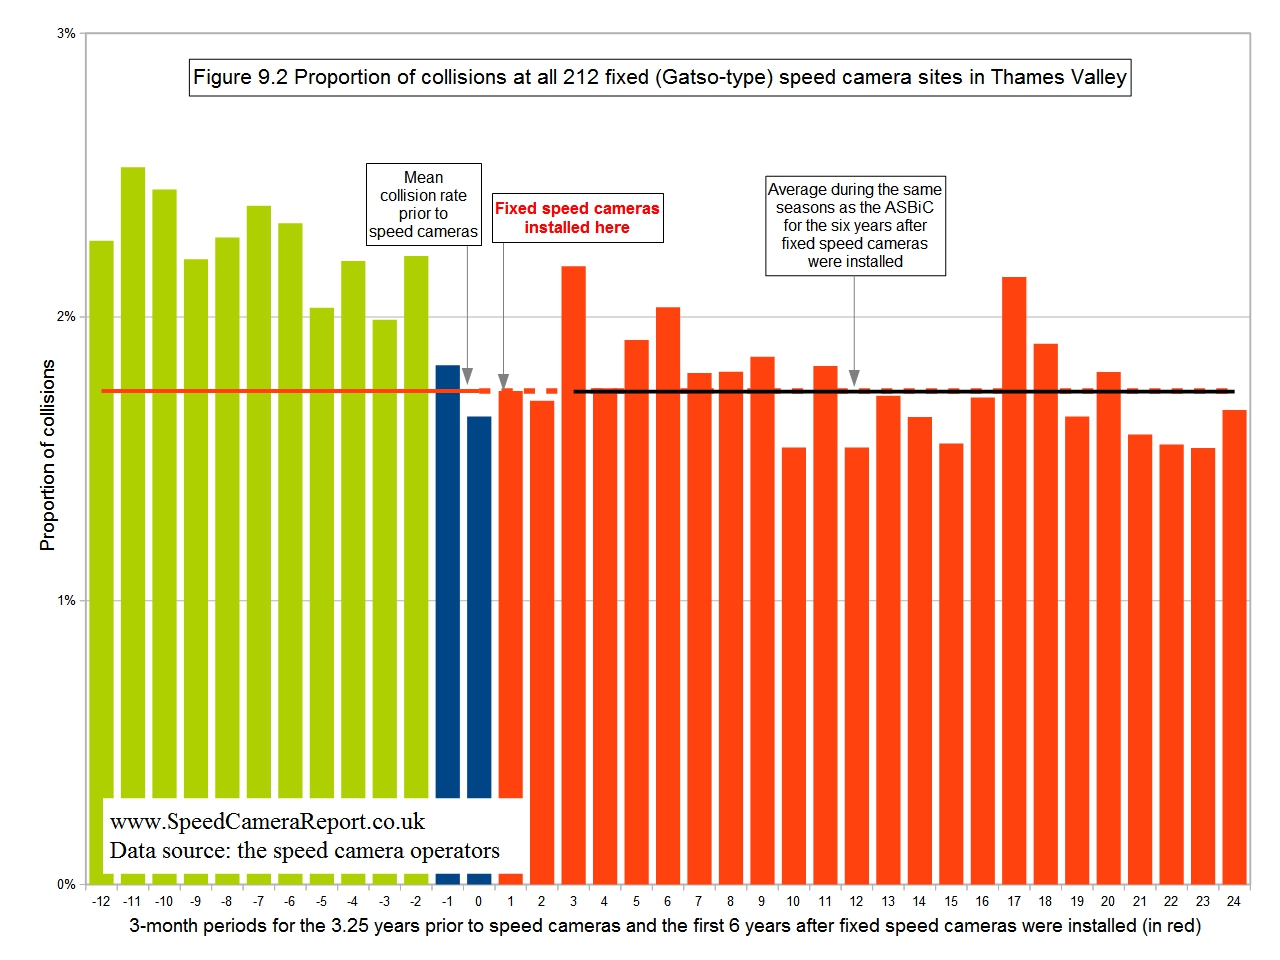
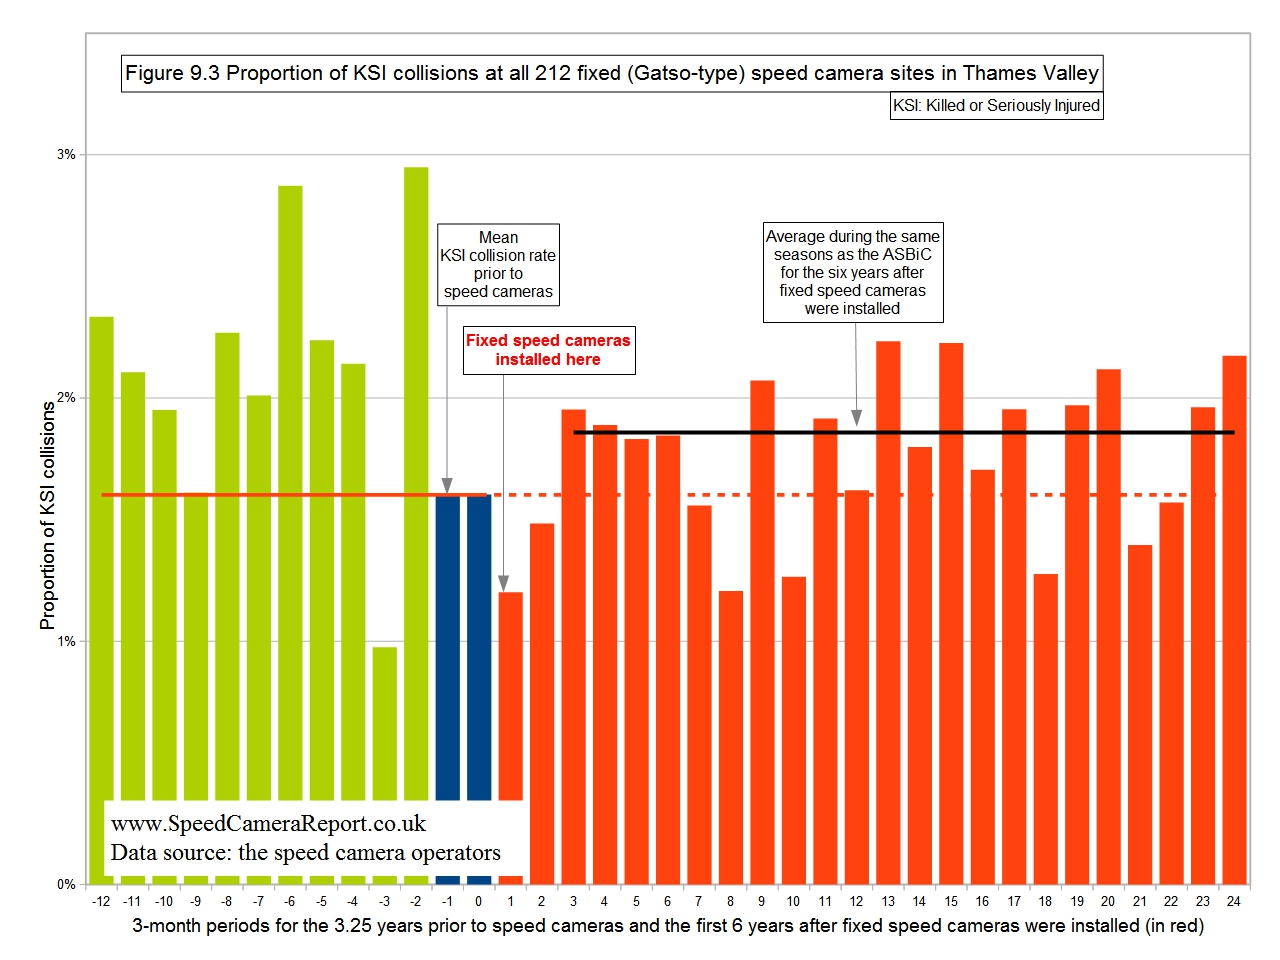
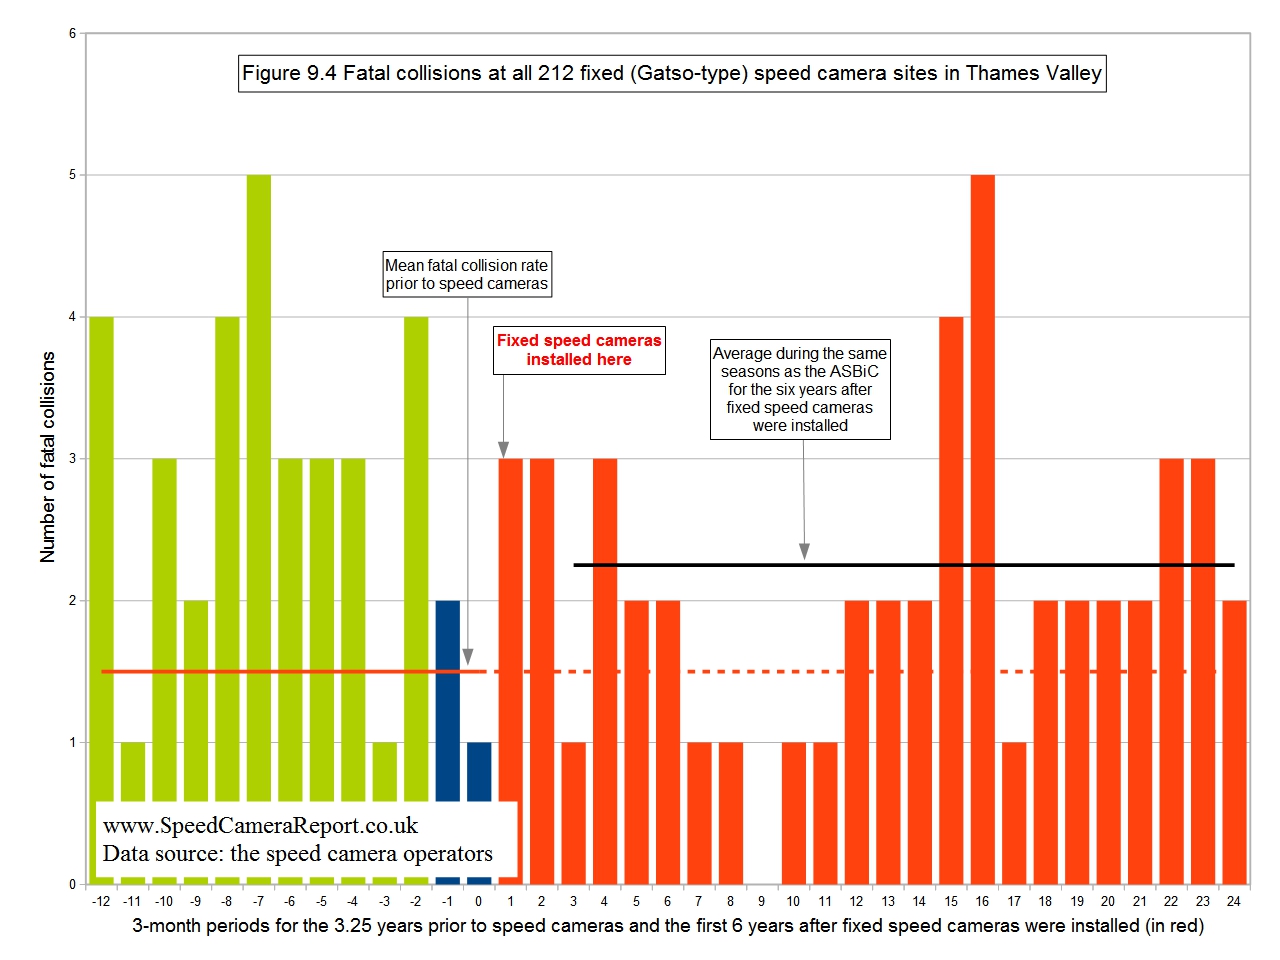
In Figures 9.2, 9.3 and 9.4:
- Before speed cameras, the mean collision rate was established using the data during the ASBiC period. This is displayed and labelled (red line).
- The mean collision rate before speed cameras is the rate expected to have continued had speed cameras not been installed (red dotted line).
- The average collision rate in the same seasons as the ASBiC after fixed speed cameras were installed is displayed and labelled (black line).
- Although large reductions in all severities of collision did occur at these sites, the entire reductions had already occurred six months before the speed cameras were installed.
- Mean rates for all severities of collision were the same or higher with speed cameras, than they were without speed cameras.
9.9 Results:
At the 74 most recent fixed speed camera sites in Thames Valley (9):
- Overall results comparing three years before and after (compensated for general influences), there was:
- a 43% reduction in KSI collisions.
- a 29% reduction in all collisions.
- The above overall results include the effect of RTM, followed by the effect of the speed cameras:
- Measurements showed there was:
- a 48% reduction in KSI collisions due to RTM.
- a 23% reduction in all collisions due to RTM.
- Measurements showed there was:
- After the effect of RTM, there was then:
- an 11% increase in KSI collisions after fixed speed cameras were installed.
- a 7% reduction in all collisions after fixed speed cameras were installed.
At all 212 fixed speed camera sites in Thames Valley (9):
- Final results (compensated for general influences and not including any RTM effects or seasonal bias) there was:
- a 38% increase in fatal collisions after fixed speed cameras were installed.
- a 16% increase in KSI collisions after fixed speed cameras were installed.
- a 0% change in all collisions after fixed speed cameras were installed.
9.10 Conclusions:
At the 74 most recent fixed speed camera sites in Thames Valley, there was an overall 43% reduction in KSI collisions and, at speed camera sites across Britain, there was a 42% reduction in KSI (10a).
- Overall results at speed camera sites in Thames Valley and across Britain were similar.
Overall results such as these have been presented as evidence of the benefits of speed cameras but, while both results have been adjusted to compensate for the effects of general influences, they also do include the effect of RTM. The government’s largest report estimated that RTM may have caused a 34% reduction (10b). This would make RTM the largest factor at speed camera sites therefore, to accurately determine the much smaller effect of the speed cameras, RTM needs to be measured. At the 74 most recent fixed speed camera sites in Thames Valley, measurements showed a 48% reduction due to RTM.
- When measured, the effect of RTM was found to be greater than estimates had suggested.
The overall reduction of 43% at sites in Thames Valley was found to be the combination of a 48% reduction due to RTM followed, by an 11% increase after the speed cameras were installed. Overall results at speed camera sites (where several years before and after are compared) can therefore give a completely false indication of the effect of speed cameras.
- The method of using overall results at sites to assess speed camera effects is not fit for purpose.
- Speed cameras in Thames Valley and across Britain are not demonstrated to have saved any lives or prevented any serious injuries.
At the 212 fixed speed camera sites in Thames Valley there was a large reduction in collisions but, because the entire reduction had already occurred six months before they were installed, the speed cameras could not have caused any of this improvement. The evidence suggests that the collision reduction was entirely due to RTM, with the speed cameras producing no benefit whatsoever. Furthermore, fatal and KSI collisions increased after fixed speed cameras were installed.
Overall, the evidence suggests that:
- Reducing vehicle speeds using fixed speed cameras has no impact in improving road safety.
- Fixed speed cameras do not save lives and do not prevent serious injuries.
- Fixed speed cameras are not demonstrated to have reduced the number of collisions.
This is only the second speed camera report in which the final results do not include any RTM effects and both reports found increases in fatal and KSI collisions after speed cameras were deployed (11). This is in stark contrast to official reports which consistently suggest that the speed cameras might have caused some or all of the reductions in collisions at speed camera sites. The most likely explanation for this discrepancy is that official reports are finding collision reductions that are due to RTM, and they are then incorrectly attributing those reductions to the presence of the speed cameras.
- Overall, the failure of official reports to demonstrate that they have completely excluded the effects of RTM from their results, has resulted in there not being any good quality evidence that speed cameras have produced a positive benefit for road safety.
The quality of evidence in official reports needs to be significantly improved. The authorities could use the FTP method but, while it may be the most accurate, it has limitations. It cannot account for the effects of co-intervention or selection effects other than RTM and, crucially, if the SSP is not correctly identified, RTM may not be fully excluded.
The FTP method has been used in three reports so far and the following SSPs were used (12):
- Report 1 identified the SSP to have been a 2.5 year duration – at mobile speed camera sites in Thames Valley.
- Report 2 assumed the SSP had been a 3 year duration – at fixed speed camera sites across England.
- Report 3 identified the SSP to have been a 5.5 year duration – at fixed speed camera sites in Thames Valley.
After report 1 identified the SSP at some speed camera sites to have been a duration of 2.5 years, it might have seemed reasonable for report 2 to have assumed an SSP of 3 years duration at other speed camera sites. The largest group of sites within report 2, though, were the fixed speed camera sites in Thames Valley and this report (report 3) has identified the SSP at these sites to have been a duration of 5.5 years. The actual SSP for sites in report 2 was therefore significantly longer than had been assumed and the results within report 2 may therefore include significant levels of RTM.
- All of the problems associated with the poor quality of evidence in official reports, and the limitations of the different analysis methods, could be solved simply by running speed cameras within scientific trials.
9.11 Recommendations:
- Speed cameras must only be operated within scientific trials.
- These should take the form of independently supervised “randomised controlled trials”. All trials should conform to a national standard so that the results can be combined into a national evidence database. In this way, the effects of speed cameras could be demonstrated and quantified scientifically.
- Increases in fatal and KSI collisions at fixed speed camera sites should be independently investigated.
9.12 Acknowledgements, references and supplementary information.
