
DOES REDUCING TRAFFIC SPEED USING SPEED CAMERAS REDUCE THE NUMBER OF COLLISIONS?
7.1 Terms.
7.2 Abstract.
7.3 Conclusions.
7.4 Summary of findings.
7.5 Recommendations.
7.6 Introduction.
7.7 Changes in vehicle speeds at camera sites and predicted reductions in collisions.
7.8 Number of collisions on roads in Thames Valley and number of speed cameras.
7.9 Method to exclude the Selection Bias effect (aka RTM).
7.10 Method to compensate for other influences.
7.11 Specific effects at camera sites that could not be examined in this report due to insufficient data.
7.12 Results.
7.13 Acknowledgements, references and supplementary information.
7.1 Terms.
TVSRP: Thames Valley Safer Roads Partnership (The organisation that operated the speed cameras 2000-2011).
Collisions: All the road traffic collisions that result in fatal, serious or slight injuries as recorded by Police.
RTM: Regression to the mean (or return to normal) due to the site selection process (aka selection bias).
SSP: Site Selection Period (The period of time during which the collisions that influenced site selection occurred).
ASBiC: After Selection but Before Installation of Cameras (The time taken to get the cameras on site after the SSP).
7.2 Abstract.
This report investigates whether the central theories of “speed management” are true when applied in practice using speed cameras.
In 1994, the Transport Research Laboratory (TRL) reported (1) that, when comparing similar roads, there were 5% fewer collisions for every 1mph slower the average speed of traffic. This finding is at the heart of “speed management” that has been adopted by nearly all UK authorities involved in road safety, and was confirmed in a larger study (2) by TRL in 2000.
While both the TRL studies were based on recorded speeds and collisions, they didn’t establish that one caused the other. There may have been other factors that led both to the higher speeds and also to the higher number of collisions; therefore simply attempting to reduce vehicle speeds may leave in place the factors that caused the collisions. Also, measures taken to lower speed may introduce unexpected side effects that could contribute to more collisions.
In order to determine if reducing the speed of traffic does result in fewer collisions in practice, this report investigates the effect of all 317 speed camera sites (both fixed and mobile) that were active at the start of 2009 in Thames Valley.
In order to prevent results being confounded by selection bias (aka RTM, regression to the mean), the period of time during which the collisions that influenced site selection occurred is investigated and numbers of collisions are displayed in detail for the two years leading up to the installation of the sites and for the first two years after. This allows a comparison of the rate of collisions before and after the cameras which excludes most of the selection bias effect.
There are also a multitude of other influences at camera sites – including rising traffic volumes, safer vehicle design and Police reporting practices – therefore collision numbers at camera sites are expressed as a percentage of the annual number of collisions across the whole Thames Valley area. This allows a comparison of the rate of collisions before and after the cameras which compensates for these influences.
Results are obtained for fixed camera sites and mobile camera sites separately, along with both types combined.
7.3 Conclusions.
- Speed cameras have not made any impact in preventing road traffic collisions.
- There was no reduction in the number of collisions at fixed (Gatso) camera sites after they were installed and there was no reduction in the number of collisions at mobile camera sites after they started operating.
- Even after compensating for other influences, such as rising traffic volumes and safer vehicle design, the cameras are still not demonstrated to have resulted in any reduction in collision rates. In fact, collision rates increased at mobile speed camera sites following deployment relative to all roads in the Thames Valley area.
- There was found to be no relationship between vehicle speeds and the number of collisions. Reductions in speeds at camera sites (both average and above the speed limit) did not result in any reduction in the number of collisions.
It must be concluded that the central theories of speed management do not work when applied in practice using speed cameras. If there really is a relationship between collision rates and speed (average or above the speed limit), this is either not a causal one or cameras have negative side effects that contribute to as many or more collisions than the reduced speeds prevent.
This suggests that locations labelled “accident black spots” either:
- Remained “accident black spots” even with the cameras in operation, or
- Those locations were not really “accident black spots” at all having simply suffered an abnormal number of collisions that dropped back to normal before the cameras were deployed.
This also suggests that, where cameras were placed following “speed related” collisions, the speeds were within the speed limit, or those collisions involved other more serious contributory factors, or cameras have negative side effects.
These results should not be particularly surprising considering that Police investigations (3) find that 5.5% of collisions in Thames Valley involve a vehicle that was speeding (exceeding the speed limit). To prevent even the 5.5% of collisions that involved speeding would require that cameras prevent all vehicles exceeding the speed limit, that there are no factors other than speeding in those collisions and that cameras have no negative side effects.
The evidence suggests that, where reductions in collision rates have been claimed at speed camera sites in Thames Valley, those reductions were entirely due to selection bias (aka RTM) with the cameras having achieved no benefit at all.
7.4 Summary of findings.
At all 317 speed camera sites in Thames Valley where 464 speed cameras were deployed:
- 0.4% increase in the number of collisions following deployment.
- 0.2% reduction in the number of collisions following deployment relative to the whole Thames Valley area.
At all 212 fixed speed camera sites where 359 speed cameras were deployed:
- Average speed of traffic reduced by 4.7mph.
- 0.5% increase in the number of collisions following deployment.
- 2.5% reduction in the number of collisions following deployment relative to the whole Thames Valley area.
At all 105 mobile speed camera sites:
- Average speed of traffic was not measured
- 0.2% increase in the number of collisions following deployment.
- 6.3% increase in the number of collisions following deployment relative to the whole Thames Valley area.
7.5 Recommendations.
Further investigation is needed. It seems unlikely that the effect of speed cameras in Thames Valley would be significantly different from those anywhere else, and therefore this report recommends that all speed cameras in the UK should only be operated within independently organised and independently supervised rigorous Randomised Controlled Trials. This could ensure that, if any benefit is being achieved, this can be demonstrated and quantified.
An independent investigation is recommended to determine why there has been a relative increase in the number of collisions following enforcement by mobile cameras. For instance, further research could investigate how the factors that contributed to collisions changed at mobile sites following speed limit enforcement and were the collision rates with the camera vans on site different to the collision rates when the sites were unattended?
7.6 Introduction.
Research by TRL (2) states (p38) “The 5% figure for the reduction in accident frequency per 1mile/h reduction in mean traffic speed remains a useful and robust overall rule”, (p39) “The higher the average speed of those drivers who speed, the more accidents – the accident frequency rises by 19% if the average speed of the speeders increases by 1mile/h”, and (p38) “However, persuading the lower speed drivers to reduce their speeds still further should not be neglected”.
When applying these findings in practice, speed cameras ought to be particularly effective at reducing both speeds above the limit and average speeds and therefore, according to TRL, the number of collisions should be dramatically reduced.
Due to the random nature of collisions, and the low number of them on any particular section of road, it is not possible to determine the effectiveness of individual cameras. This report therefore considers all fixed cameras as a group, all mobile cameras as another group and both groups combined to evaluate the overall effect of all speed cameras in Thames Valley.
In order to investigate this, effects due to cameras must be separated from other effects. Therefore this report will:
- Examine collision rates at all speed camera sites in Thames Valley, including the fixed and mobile cameras separately.
- Exclude most of the selection bias effect (aka RTM).
- Compensate for the multitude of other effects.
Even if no cameras had been used, selection bias could be expected to cause a reduction in collision rates at camera sites because the sites are likely to have been chosen following an above average number of collisions. Accounting for selection bias has always been problematic. Official reports on speed cameras have ignored the effect, used complicated formulae to predict collision rates, used sites not eligible for cameras as comparison sites or used theoretical models (4). Although these methods can provide approximate values, the author has not found a report that has demonstrated successful compensation for selection bias and that means that the effectiveness of cameras has not been established.
Rather than estimate the value of selection bias, this report simply excludes most of its effect, thereby aiming to obtain the most accurate evaluation of the effect speed cameras have on the number of collisions.
7.7 Changes in vehicle speeds at camera sites and predicted reductions in collisions
Table 7.1 shows the predicted reductions in collision rates at camera sites based on reductions in average speeds.
| Table 7.1 | Fixed | Mobile |
| Change in average speed | -4.7mph | -1.3*mph |
| Predicted change in collisions | -21.3% | -6.4% |
*TVSRP did not perform surveys on vehicle speeds at their mobile camera sites (5) in Thames Valley, but we can reasonably expect that average speeds reduced by a similar amount as was measured at other sites nationally (6).
Average speeds at fixed camera sites (7) in Thames Valley fell by 4.7mph which should result in over 20% fewer collisions at the sites but far higher reductions than these ought to be achieved in practice. Every 1mph reduction in speeds above the speed limit is predicted to result in a 19% reduction in numbers of collisions.
What period of time should be considered after the camera sites were installed?
At fixed camera sites nationally (6), the fall in speeds after installation was (p29) “immediate and sustained” and the experience of road users also seems to be that vehicle speeds reduced immediately and remained lower. For speeds at mobile camera sites nationally (p30) “…the reductions were not just ‘ one-off’ but were sustained over time.”
Because speeds reduced immediately, the rate of collisions should also have reduced immediately, suggesting that only the first year of camera operations need be considered. This would also allow the greatest number of mobile sites to be included in the analysis, figure 7.1.
On the other hand, there may have been some short term effects as motorists adjusted to the presence of the cameras. The fixed cameras were not initially painted yellow and were installed at a time when GPS devices with camera locations were not in widespread use. In addition, mobile camera vans may only spend a few hours at each site, not visiting again for days or weeks. The vast majority of drivers may pass mobile camera sites when the camera van is not there, so driver behaviour might alter more slowly over the following months.
In order to ensure that the full effects of the cameras are included, this report considers the rate of collisions during the two years following deployment of the speed cameras. If cameras have not resulted in a change in collision rates within two years, it seems unlikely they will affect collision rates in further years.
7.8 Number of collisions on roads in Thames Valley and number of speed cameras.
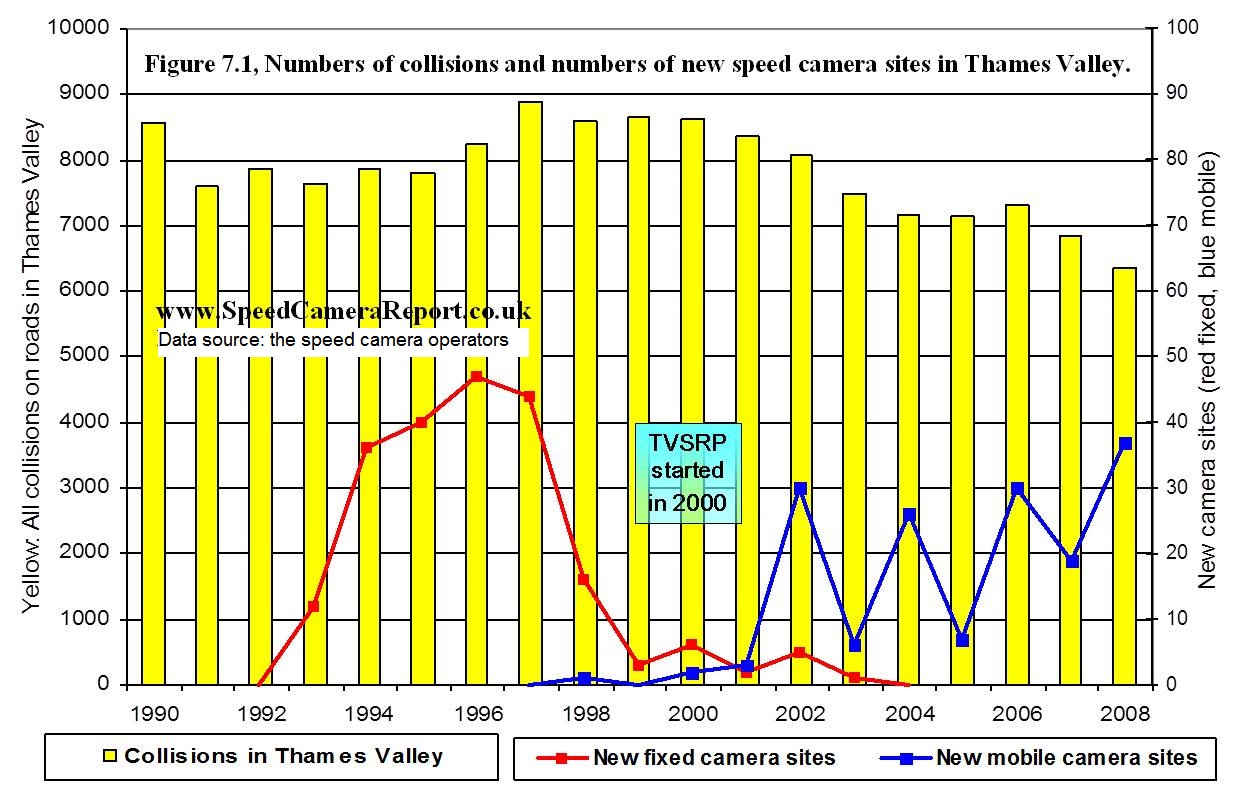
Figure 7.1 shows how many new camera sites were installed each year and these can be considered in two time periods. Almost all of the fixed cameras were installed by local authorities in the years 1993 to 1998, with their operation taken over by TVSRP when it formed in 2000. Almost all of the mobile camera sites were installed by TVSRP from 2002 onwards. This information is used to exclude the selection bias effect (7.9).
Figure 7.1 also shows the total number of collisions that occurred on the roads of Thames Valley within each calendar year (not just at camera sites). This information is used to compensate for other influences at camera sites (7.10).
Table 7.2, the number of speed cameras included within this report.
| Table 7.2 | Fixed | Mobile | Total |
| Active camera sites in Thames Valley | 212 | 161 | |
| Camera locations within those sites | 359 | 161 | |
| Sites included in analysis (at least two years operation) | 212 | 105 | 317 camera sites |
| Camera locations within those sites | 359 | 105 | 464 camera locations |
Note, “Sites” are selected lengths of road (8) that can be between 400-1500m (fixed) or between 400-3000m (mobile).
Note, “Locations” are where the cameras are within each site such as Gatso housings (fixed) or where camera vans operate (mobile).
Note, the housings do not contain actual cameras at all times; the working parts of the cameras are rotated around the available locations.
7.9 Method to exclude the Selection Bias effect (aka RTM)
Authorities choose locations for speed cameras following analysis of where collisions had occurred during the SSP (Site Selection Period), and this process tends to favour selection of those sites where the numbers of collisions were higher than normal. Therefore collision rates would be expected to be lower after the SSP, whether or not cameras had been deployed. This reduction that is caused by selection bias is often referred to as RTM (regression to the mean) and, crucially, it occurs before the cameras are installed whereas any reductions due to cameras can only occur after they are installed. Camera sites can be considered to have three distinct time periods:
- SSP (Site Selection Period) – The period of time during which the collisions that influenced site selection occurred.
- ASBiC (After Selection but Before Intervention Commenced) – The time taken to get the camera installed.
- Speed cameras in operation.
Selection bias for the included camera sites can only affect numbers of collisions during the SSP. Therefore a comparison of the collision rate during the ASBiC with the collision rate after cameras will exclude the selection bias effect. While the end of the ASBiC is the recorded installation date for each site, the start and end dates of each site’s SSP are not available, and therefore an assessment of the ASBiC duration must be made.
ASBiC for mobile cameras (time taken to start camera enforcement after the end of the site selection period)
TVSRP formed in 2000 and they selected almost all of the new mobile sites (Figure 7.1). These sites needed to conform to DfT (Department for Transport) guidelines and then required DfT approval. As a result, they took a long time to be evaluated, selected and authorised. Conversations with TVSRP along with analysis of the data suggest that it consistently took around a year after the SSP before enforcement started. Indeed, after forming in 2000 with the purpose of taking over all speed camera operations and installing more speed camera sites, new sites didn’t increase markedly until 2002.
As a result, reductions in collision rates due to selection bias could be expected around one year before the start of mobile camera sites. Therefore the effect of selection bias can be completely excluded by comparing the number of collisions in the one year directly before the start of cameras (the ASBiC) with the average per year after cameras.
ASBiC for fixed cameras (time taken to install cameras after the end of the site selection period)
Figure 7.1 shows that the vast majority of fixed cameras were installed between 1993 and 1998 (before TVSRP formed) at a time when cameras did not need to conform to guidelines and did not require DfT approval. As a result they could be in place relatively quickly, in some cases just over six months after the end of the SSP. But delays with installation, particularly getting power to the sites, meant that many cameras took nearer a year to install.
The ASBiC for fixed camera sites varied between six months and just over twelve months therefore, when the fixed cameras are considered together, there will be no selection bias effects in the six month period directly before cameras were installed but this report will consider the ASBiC to be a full twelve months. This is in order to combine results for fixed and mobile camera sites, to exclude seasonal bias and to increase confidence in the numbers of collisions before cameras. While the number of collisions that occurred in the one year directly before the installation of fixed camera sites still contains some of the selection bias effect, it excludes the majority of it.
7.10 Method to compensate for other influences
The annual collision figures for the whole Thames Valley area (figure 7.1) reflect a multitude of influences* which should also affect the number of collisions at camera sites. Therefore collision numbers at camera sites are expressed as a percentage of the annual number of collisions across the whole Thames Valley area so that a comparison of collision rates before and after cameras can be made that compensates for all of these effects.
*The multitude of influences include rising traffic volumes, safer vehicle design, Police reporting practices, seat belt wearing rates, state of the economy, cost of fuel, number of drunk drivers and number of new inexperienced drivers.
In other words, if the number of collisions increase or decrease across the whole Thames Valley area, then the influences that caused that could also be expected to increase or decrease the number of collisions at camera sites in proportion.
The accuracy of this method relies on the net result of all of these effects at all of the camera sites being proportional to their effects across the whole Thames Valley area and also on speed cameras not affecting the area-wide figures significantly. This method has the advantage of not having estimated or approximate correction factors or trend values.
7.11 Specific effects at camera sites that could not be examined in this report due to insufficient data.
Diversion of traffic. Where speed cameras are used, some motorists may divert (9) to routes without cameras. When they do this, any collisions they have will not occur at the camera sites, but will occur on other roads instead. This will produce an apparent benefit at the camera sites that is not a genuine benefit to road safety.
Co-intervention (aka site treatment). Some sites may have been treated with several safety measures, including a speed camera. Co-intervention was common practice before 1999 when almost all of the fixed cameras in this report were installed. Benefits at some fixed camera sites may have been produced by other treatments.
After 2001, criteria (10) stated that cameras should be used where (p91) “No other engineering solutions are appropriate”. Almost all mobile camera sites started after these criteria were specified and so therefore should not have been used in conjunction with other safety measures.
7.12 Results.
Figure 7.2 shows all the collisions that occurred at all of the camera sites in every calendar month for two years leading up to camera sites being installed, and every calendar month for the first two years of speed camera enforcement.

The average number of collisions every twelve months (in blue before cameras and pink after) show a significant fall that occurred around a year before cameras.
Since safety devices cannot prevent collisions before they are introduced, any reduction a year before cameras cannot be due to the cameras but is at a time that reductions due to selection bias are expected (around the end of the SSP for most cameras, 7.9).
Table 7.3, Excluding the majority of the selection bias effect from the results is achieved by comparing the number of collisions in the year before cameras with the average in the 2 years after.
| Table 7.3 | Fixed | Mobile | Fixed and mobile sites |
| Number of collisions in the year before cameras. | 624 | 217 | 841 |
| Number of collisions per year in the first two years of camera enforcement. | 627 | 217.5 | 844.5 |
| Change in collision rates after the start of speed cameras. | +0.5% | +0.2% | +0.4% |
Table 7.3, There was virtually no change in the number of collisions across the entire 317 camera sites in Thames Valley after speed enforcement started. Neither the fixed nor the mobile cameras demonstrate any reduction in collision rates.
Table 7.4, The collisions at camera sites are expressed as a percentage of the Thames Valley area-wide annual figures. This is to compensate for a multitude of influences (7.10) such as rising traffic volumes and safer vehicle design.
| Table 7.4 | Fixed | Mobile | Fixed and mobile sites |
| Proportion of collisions in the year before cameras. | 7.7% | 2.7% | 10.40% |
| Proportion of collisions in the first two years of camera enforcement. | 7.5% | 2.9% | 10.37% |
| Change in collision rates after the start of speed cameras. | -2.5% | +6.3% | -0.2% |
Many fixed cameras were installed at a time when numbers of collisions were increasing across the Thames Valley area (figure 7.1). Therefore, had cameras not been installed, numbers of collisions at the camera sites could have been expected to have increased in proportion. Table 7.4 shows that numbers of collisions reduced by 2.5% at fixed camera sites relative to the whole Thames Valley area. Other factors influencing this result may include some remaining selection bias effects (7.9), the effect of any co-intervention measures (7.11) and some diversion of traffic (7.11). Each of these could account for this level of reduction, therefore the fixed cameras are not demonstrated to have reduced the number of collisions.
Many mobile camera sites were installed at a time when numbers of collisions were decreasing across the Thames Valley area (figure 7.1). Therefore, had cameras not been deployed, numbers of collisions at the camera sites could have been expected to have decreased in proportion. Table 7.4 shows that numbers of collisions increased by 6.3% at mobile camera sites relative to the whole Thames Valley area. While there should have been no co-intervention measures (7.11) and no remaining selection bias (7.9), any diversion of traffic (7.11) should have caused a reduction. Further analysis is required to determine why there has been a relative increase in the number of collisions following enforcement by mobile cameras.
7.13 Acknowledgements, references and supplementary information (separate page)
