
THE EFFECTS OF MOBILE SPEED CAMERAS ON ROAD SAFETY

Speed cameras have been in use for over 20 years, yet evidence of their effect on road safety is surprisingly weak. The quality of evidence in previous speed camera reports has been assessed in two systematic reviews.
The first, published by the British Medical Journal (BMJ) (1), searched worldwide for the best quality studies of the effects of speed cameras on road safety and compiled a short list of 92 reports. Of these, only 14 met their selection criteria and were included in the final analysis. The BMJ review found that “The level of evidence is relatively poor, however, as most studies did not have satisfactory comparison groups or adequate control for potential confounders.”
The second, published by the Cochrane Collaboration (2), also searched worldwide for the best quality studies finding 35 reports that met their criteria, although only 28 of those measured the effect on crashes. They reported “The quality of the included studies in this review was judged as being of overall moderate quality at best…”.
Neither of the systematic reviews could find any scientific trials of speed cameras (such as randomised controlled trials) and both systematic reviews concluded that the quality of evidence needed to be improved.
Although official reports have consistently found large reductions in the number of KSI casualties (killed or seriously injured) at the sites where speed cameras operate, two prominent UK reports (3) have estimated that substantial KSI casualty reductions would have occurred anyway (without the speed cameras) largely due to the effects of regression to the mean (RTM). The author has not found any official report in which RTM effects have been measured (rather than just estimated) therefore the effects of the actual speed cameras have not been established. The author considers this to be the fundamental reason why the evidence presented in official reports has been judged to be generally of poor quality.
The main purpose of this report, therefore, was to measure RTM effects at the speed camera sites, and to exclude RTM effects from the final results in order to produce the most accurate report on the effects of speed cameras to date.
Both systematic reviews only considered the effects of speed cameras within the vicinity of the cameras, area-wide or national effects were not considered. This report also only considers the effects of speed cameras within the camera sites.
Contents
8.1 Terms
8.2 Conclusions
8.3 Recommendations
8.4 Introduction
8.5 Method to determine mean collision rates prior to speed cameras
8.6 Identifying the SSP (Site Selection Period)
8.7 Compensating for general influences
8.8 Checking for longer term effects
8.9 Determining mean collision rates prior to speed cameras
8.10 Results
8.11 Acknowledgements, references and supplementary information
8.1 Terms
Collisions: Road traffic accidents that result in fatal, serious or slight injuries, as recorded by Police
KSI: Killed or Seriously Injured. People who suffer fatal or serious injuries in collisions
SSP: Site Selection Period (The period of time during which the collision rate influenced site selection)
Mean: The expected (or normal) value of a random variable
RTM: Regression To the Mean (or return to normal)
8.2 Conclusions
This report evaluates the effects of mobile speed cameras in Thames Valley using the official database containing the number and severity of collisions and casualties at each speed camera site, as recorded by Thames Valley Police. The database was created and verified by the organisation that operated the speed cameras, the Thames Valley Safer Roads Partnership (TVSRP). The database has data for 517 speed camera sites including 75 mobile speed camera sites that were active at the start of 2009 and that had been operating for three or more years. This report evaluates the 75 mobile speed camera sites.
The standard method used to assess the effects of speed cameras is to compare a period after the speed cameras were deployed (often the first three years) to a baseline period before (typically the three years used to select the sites). Using this method, a 42% reduction in KSI casualties and a 22% reduction in all casualties were found at the mobile speed camera sites in Thames Valley (Table 8.1). These results include the effects of RTM, general influences and the mobile speed cameras.
Analysis of the period prior to the mobile speed cameras found that RTM resulted in a 51% reduction in KSI casualties and a 20% reduction in all casualties at the sites (Table 8.2). Therefore RTM was found to be responsible not only for the entire KSI casualty reduction, but the reduction would actually have been greater had an increase not occurred after the mobile speed cameras were deployed. Also, the reduction due to RTM could explain almost all of the reduction in all casualties.
This report concludes that the entire benefit observed at speed camera sites may be due to RTM, with the speed cameras producing no benefit whatsoever. Therefore the standard method used to assess road safety interventions (where comparisons are made using a baseline period that includes the SSP) (4) is not fit for the purpose of determining the effects of speed cameras (or any other road safety interventions).
The final analysis compared the mean rates at the sites relative to all roads in Thames Valley before and after mobile speed cameras were deployed (Table 8.3), and also calculated the changes in numbers due to the changes in relative mean rates (Table 8.4). The final results found that, during the first three years of mobile speed camera operations, there were:
- a 25% increase in the relative mean rate of fatal collisions (3 more)
- a 74% increase in the relative mean rate of fatal casualties (9 more)
- a 19% increase in the relative mean rate of KSI collisions (13 more)
- a 31% increase in the relative mean rate of KSI casualties (23 more)
- an 11% increase in the relative mean rate of all collisions (55 more)
- a 9% increase in the relative mean rate of all casualties (59 more)
As these final results are the changes that occurred at mobile speed camera sites having excluded RTM effects and having compensated for the effects of general influences (such as rising traffic volumes and safer vehicle design), they should be about as accurate an evaluation of the effects of mobile speed cameras as is possible given the data available.
- The evidence suggests that the policy of using mobile speed cameras has contributed to more collisions, more serious injuries and more deaths on the roads where they operate.
This report highlights the difficulty of assessing the effects of speed cameras when they are not deployed within scientific trials. Speed cameras are not the only factor influencing the number and severity of collisions and casualties and this report has discovered that, even when the standard method (4) finds significant reductions in KSI casualties at speed camera sites, it cannot be assumed that the speed cameras made any beneficial contribution to those reductions.
Furthermore, increases in collision and casualty rates suggest that the negative side effects of mobile speed cameras may be larger than the positive benefits. There are a multitude of factors that contribute to collisions but the vast majority of even the most serious collisions occur when motorists are not speeding. For example, Police collision investigations find fewer than 8% of KSI collisions involve a vehicle that was speeding (Table 1.5) and further evaluation finds that fewer than 0.5% of motorists might cause a KSI collision while speeding in their lifetime (5). This includes those possibly more likely to speed and be involved in collisions, such as drivers of stolen cars, motorists under the influence of alcohol or other drugs, joy riders, inexperienced motorists, criminals, riders of sports motorbikes etc. While speed cameras may beneficially influence some of the 0.5%, they may in the process change the behaviour of the majority of other motorists. If more than 99.5% of motorists will never cause a KSI collision while speeding in their lifetime, but speed cameras then change their driving style (priorities, concentration levels etc), this might explain the increases in casualties occurring at these mobile speed camera sites.
The quality of evidence in previous speed camera reports has been assessed in two systematic reviews (1,2) and judged to be “relatively poor” or “overall moderate quality at best”. Both reviews recommended better quality trials and the results of this report further demonstrate the urgent need to substantially improve the quality of evidence.
- Overall, this report concludes that the decision not to perform scientific trials, and the subsequent failure of official reports to demonstrate that they have completely excluded the effects of RTM from their results, has resulted in there not being any good quality evidence that speed cameras have produced a positive benefit for road safety.
8.3 Recommendations
- In order to provide the highest quality of evidence, this report recommends that speed cameras in the UK must only be operated within scientific trials which should take the form of independently organised and independently supervised rigorous Randomised Controlled Trials. All trials should conform to a national standard so that the results can be combined into a national evidence database. In this way, the effects of speed cameras could be demonstrated and quantified scientifically.
- An independent investigation is recommended to determine why there has been an increase in the number and severity of collisions and casualties following the deployment of mobile speed cameras and to establish whether there were more collisions when the mobile speed cameras were on site (a direct effect) or when the sites were unattended (an indirect effect). The author requested data on the number of collisions recorded by mobile speed camera operators but was advised by the partnership that such incidents were not logged. Further research could compare dates and times of collisions with dates and times of mobile speed camera operations. Also, Police collision investigation reports could be analysed to determine how the factors that contributed to collisions changed at these sites following the deployment of mobile speed cameras.
8.4 Introduction
In order to evaluate the effects of speed cameras on road safety at the sites where they operate, it is necessary to determine how many collisions would have occurred had the speed cameras not been deployed. The most reliable method to achieve this is to run scientific trials (such as RCTs) but none of the authorities that selected speed camera sites decided to use this method. In the absence of scientific trials this report, like most other reports, uses collision data at the sites prior to speed cameras to determine how many collisions would have occurred afterwards had the speed cameras not been deployed.
The standard method used to assess the effects of speed cameras (and other road safety interventions) is to compare a period after the speed cameras were deployed (usually the first three years) to a baseline period before (usually the three years used to select the sites). If collisions at the sites would have continued at the baseline rate had speed cameras not been deployed, then the standard method would accurately determine the effects of speed cameras. But this is extremely unlikely.
Collision and casualty rates at each speed camera site may be influenced by several factors:
- The speed cameras
- Random variations (8.4.1)
- Regression to the mean (RTM) (8.4.2)
- General influences (or trends in road safety) (8.4.3)
- Diversion of traffic (8.4.4)
This report uses the standard method (above) to obtain a basic set of results but then uses two new methods to perform more detailed analysis. The first new method is used to determine the mean collision rate at the sites prior to speed cameras, and the second new method compensates for changes in the mean collision rate due to general influences.
8.4.1 Random variations in relatively low numbers of collisions on each short stretch of road (such as a speed camera site) may result there being insufficient data to accurately determine the mean collision rate prior to a speed camera being deployed. Therefore evaluation of the effects of a speed camera at an individual site could be very unreliable. This problem can be overcome by considering a large group of sites where sufficient data does exist to accurately determine the mean collision rate for the group. This report evaluates as a group, all mobile speed camera sites in Thames Valley that were active at the start of 2009 and that had been operating for three or more years, a total of 75 sites.
8.4.2 Speed camera sites are often selected following recent high collision rates that, due to random variations, could have been higher than the mean for those sites. Collision rates at selected sites would tend to return to the mean afterwards, whether or not speed cameras were deployed, and this change is referred to as regression to the mean (RTM). As RTM occurs due to random variations interacting with the site selection process, this report examines the period prior to speed cameras in order to identify which collisions influenced site selection and which collisions did not. The collisions that did not influence site selection can then be used to establish the mean collision rate prior to speed cameras.
8.4.3 There are a host of general influences (such as rising traffic volumes and safer vehicle design) that could cause the mean collision rate at sites to change. General influences also affect collision rates across all roads in Thames Valley therefore changes in area-wide collision rates are used to determine how mean collision rates at sites would have changed had speed cameras not been deployed. To compensate for the effects of general influences, relative collision rates are used and these are produced by expressing each collision at each speed camera site as a percentage of the annual number of collisions on all roads in Thames Valley. The relative mean collision rate at sites prior to speed cameras is then determined (as 8.4.2) and this not only enables RTM to be measured, but it is also the rate that would be expected to have continued had speed cameras not been deployed. Therefore a comparison with the relative mean collision rate after speed cameras were deployed would be the effect of the speed cameras, without RTM effects or general influences confounding the result. Compensating for general influences by using area-wide figures is not a new idea, the same basic concept is used in official reports where the “trend” is calculated (average change in area-wide figures) and the trend value is then used to adjust figures at speed camera sites.
8.4.4 Where speed cameras are used, some motorists may divert to routes without speed cameras (6). When they do this, any collisions they have would not occur at the speed camera sites, but would occur on other roads instead. By effectively moving collisions to other locations (rather than preventing them) an apparent benefit at the speed camera sites may turn out not to be a genuine benefit to road safety. The data required to evaluate this effect was not available.
Four sets of results are obtained. The first set of results uses the standard method to assess speed cameras (the first three years of speed camera operations, compared to a three year baseline period before) and the second set of results show measurements of RTM. The third set of results show changes in relative mean rates at the sites following the deployment of mobile speed cameras and the fourth set of results show the changes in numbers due to the changes in relative mean rates. Each set of results includes 3 severities of collision (fatal, KSI and all) and also 3 severities of casualty (fatal, KSI and all).
8.5 Method to determine mean collision rates prior to speed cameras
The process used by the authorities (such as local councils and partnerships) to find new sites for speed cameras generally involves analysis of recent collision data to find those sites where a high number of collisions had occurred during the SSP. A high number of collisions could suggest that a site is an “accident black spot” or, due to random variations, the number could just have been higher than the mean. Irrespective of the collision rate that led to a site being selected, collision rates would tend to return to the mean after the SSP, whether or not a speed camera was deployed. Collision rates returning to the mean (as an effect of the site-selection process) is referred to as RTM and, crucially, this change occurs before the speed cameras are deployed, whereas any changes that are due to the speed cameras can only occur after they are deployed.
Each speed camera site has four consecutive time periods:
- PreSSP – The period of time before the SSP when collisions did not influence site selection
- SSP (Site Selection Period) – The period of time during which the collision rate influenced site selection
- ASBiC (After SSP but Before Intervention Commenced) – The time taken to get the speed camera on site after the SSP
- Speed cameras in operation – The period of time after the speed camera site was commissioned
The site selection process can lead to collision rates that were different to the mean only during the SSP. At all other times, collisions should occur at around their mean rate. The method used here establishes the mean collision rate prior to speed cameras simply by identifying the SSP and then only using data from outside that period (from the PreSSP and ASBiC).
8.6 Identifying the SSP (Site Selection Period)
The only published date in the site selection process is the date each speed camera site was commissioned (this is the first day a speed camera could be in operation at the site), but it is possible to work backwards to identify the SSP for this group of 75 active mobile speed camera sites in Thames Valley.
Under the “hypothecation” scheme (also referred to as “cost recovery” or “netting-off”), the authorities could increase the number of speed camera sites and could recover their operating costs from the fine revenue raised. The Thames Valley Safer Roads Partnership (TVSRP) was one of the organisations set up to take advantage of the scheme. They were expected to find new sites for speed cameras that met criteria specified in national guidelines and then submit their proposals to the DfT (Department for Transport). After the new sites were approved, speed cameras could be deployed.
Almost all of the mobile speed camera sites in Thames Valley were commissioned by TVSRP from 2002 onwards (7) and their locations should have been evaluated, selected and authorised in compliance with the hypothecation scheme.
In the national guidelines (8), proposed mobile speed camera sites were expected to have a minimum of 4 collisions, with at least 2 of those being KSI collisions, per km in the three years prior to the proposal being submitted to the DfT. As KSI collisions are a subset of all collisions, they would have formed the basis of site selection and KSI collisions are therefore analysed to identify the SSP.
Figure 8.1 shows the number of KSI collisions at the 75 sites in six-month periods for the 8.5 years prior to speed cameras (in blue, green, blue) and the first 3 years of mobile speed camera operations (in red). Each site was commissioned within the first month of period 18. KSI collision rates were clearly different in three distinct time periods prior to speed cameras and these are identified as the PreSSP (1-10), the SSP (11-15) and the ASBiC (16-17). The average KSI collision rate during each of these three periods has been calculated, displayed and labelled.

Possibly the most interesting feature of Figure 8.1 is the sudden reduction at the end of the SSP, a full year before the mobile speed cameras were deployed. RTM at each site does not occur gradually after the SSP, it occurs immediately but this would not be observed at each site due to the infrequency of collisions. However, for a large enough group of sites where the ASBiC duration was the same for all sites, RTM should be a sudden (vertical) change at the end of the SSP. Furthermore, if the SSP duration was the same for all sites, the change at the start of the SSP should also be sudden (vertical). These features of RTM (due to random variations interacting with the site selection process) are clearly observed.
The SSP for these sites is identified to have been the 2.5 year period ending 1 year before the sites were commissioned and this is consistent with a three year baseline period (11-16) consisting of the SSP followed by the time taken to collect the data, identify eligible sites, perform site surveys and make the final selection. Submitting site requests to the DfT and gaining approval seems to have taken a further six months. TVSRP confirmed to the author that it did take around a year to get each site commissioned and indeed, after TVSRP formed in 2000 with the purpose of taking over all existing speed camera operations and applying for more speed camera sites, new sites didn’t increase markedly until 2002. It is fortunate that the ASBiC was consistently around one full year as this prevents a seasonal bias within this period.
8.7 Compensating for general influences.
Figure 8.2 shows the same KSI collisions as in Figure 8.1, but expressed as a proportion of the annual number of KSI collisions on all roads in Thames Valley (8.4.3). Figure 8.2 shows how KSI collision rates changed at the sites relative to all roads in Thames Valley and thereby compensates for general influences, such as rising traffic volumes and safer vehicle design. In 1999, Thames Valley Police changed their definition of serious injury (bringing it into line with the national definition) resulting in more types of injuries being recorded as serious from then on. This affected recorded numbers of serious injuries all across Thames Valley (including at speed camera sites) therefore this is one of the general influences compensated for in Figure 8.2.
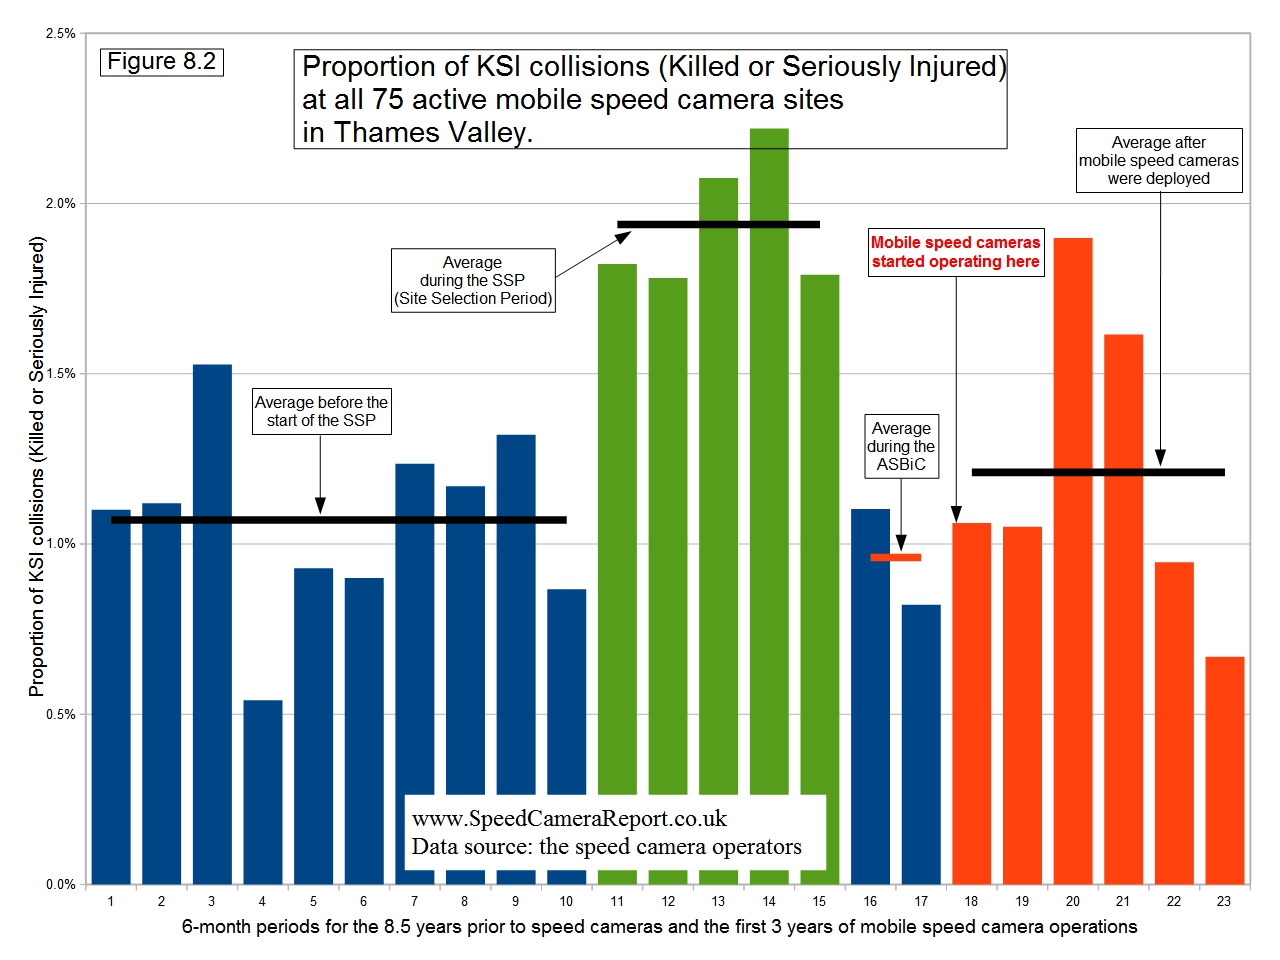
Figure 8.2 shows KSI collisions varying around the relative mean rate for the first 5 years (the PreSSP) and then the sites were selected after KSI collision rates were, on average, nearly double their relative mean level during the 2.5 year SSP. KSI collisions then returned to around the relative mean rate during the year prior to speed cameras (the ASBiC).
After mobile speed cameras were deployed, the relative mean KSI collision rate rose above the relative mean rates seen previously during both the PreSSP and the ASBiC.
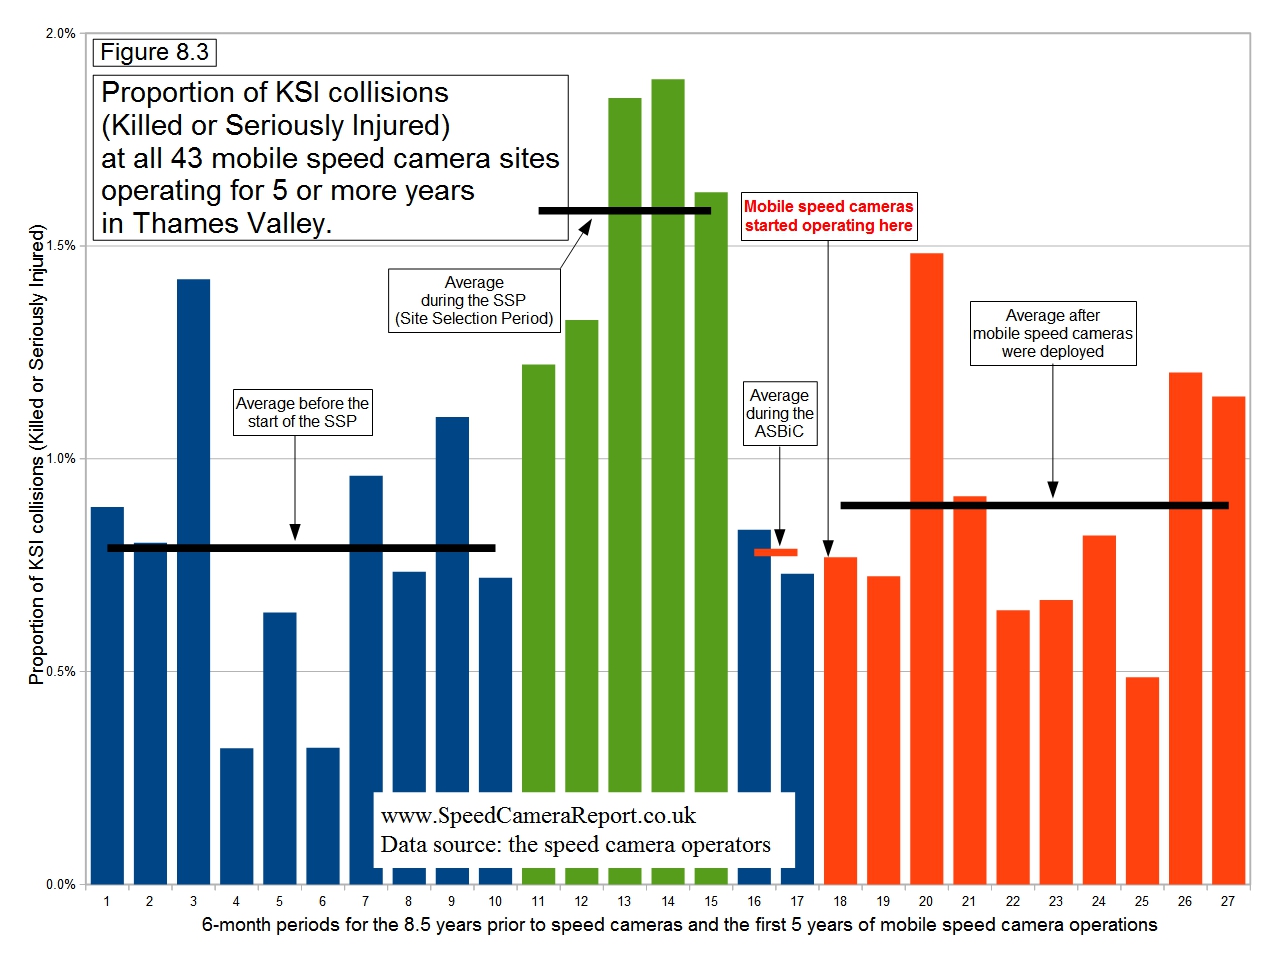
8.8 Checking for longer term effects.
After an increase at the start of the second year of mobile speed camera operations, KSI collision rates consistently reduced suggesting improvements might be observed in subsequent years. To investigate possible longer term effects, the subset of 43 mobile speed camera sites that had been operating for five or more years were analysed. Figure 8.3 shows that the decline did not continue and the relative mean KSI collision rate was again higher after mobile speed cameras were deployed than it was prior to speed cameras both during the PreSSP and the ASBiC.
8.9 Determining mean collision rates prior to speed cameras
There were two periods of time prior to speed cameras when the collision rate was occurring at around the mean, one during the ASBiC and the other during the PreSSP. The rates during these two periods need to be combined into one figure for each level of severity (fatal, KSI and all) to represent the mean rate prior to speed cameras. The ASBiC was immediately prior to speed cameras, but was only one year in duration. The PreSSP covers a five year period so gives a more reliable figure for the mean rate but ended over three years before mobile speed cameras were deployed. Therefore, to give equal weight to each, the mid-point of the rates in the PreSSP and ASBiC is calculated. The mid-point could be expected to give the most reliable value for the mean rate prior to speed cameras, but each level of severity is assessed separately.
Figures 8.1, 8.2 and 8.3 show that KSI collision rates in the PreSSP and ASBiC periods were similar and therefore the mid-point of these is assessed to give the most reliable value for the mean KSI collision rate prior to speed cameras in Tables 8.2 and 8.3.
In Figure 8.4, the unusually high number of fatalities during the SSP confirms that sites where fatalities had occurred were more likely to be selected. Outside the SSP, there was a large difference in the two fatality rates in the PreSSP and ASBiC periods largely due to the four fatalities in period 17. Although these could have been due to the sites suddenly becoming more dangerous this seems unlikely, especially considering that serious injuries reduced in that period. It is possible that these fatalities led to the sites being commissioned at very short notice, bypassing the usually lengthy selection process (ie a site-selection effect), but most likely they were simply due to the random variation inherent in such infrequent events. The mid-point of the PreSSP and ASBiC fatality rates is therefore assessed to give the most reliable value for the mean fatality rate prior to speed cameras in Tables 8.2 and 8.3.
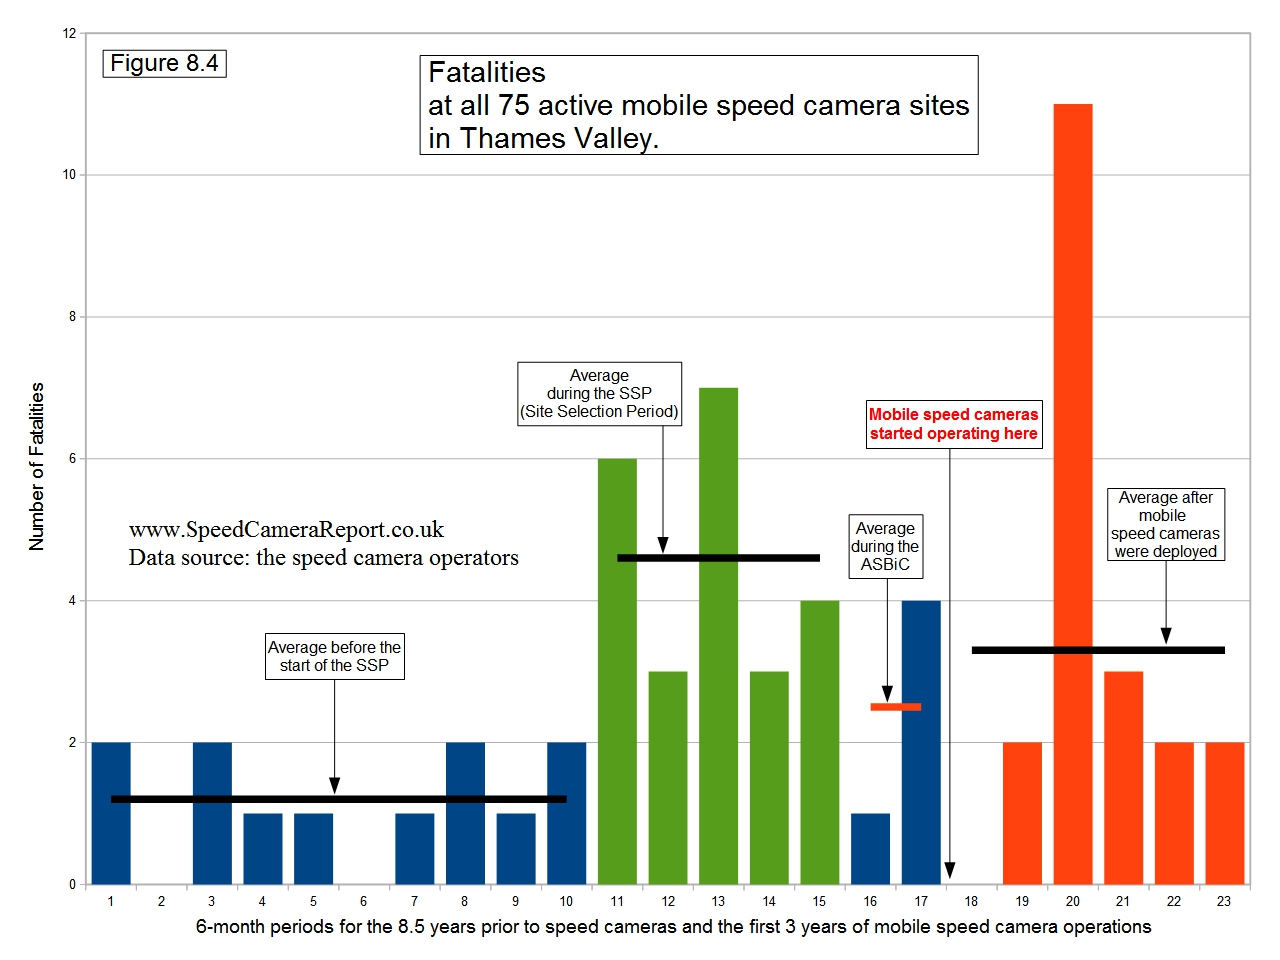
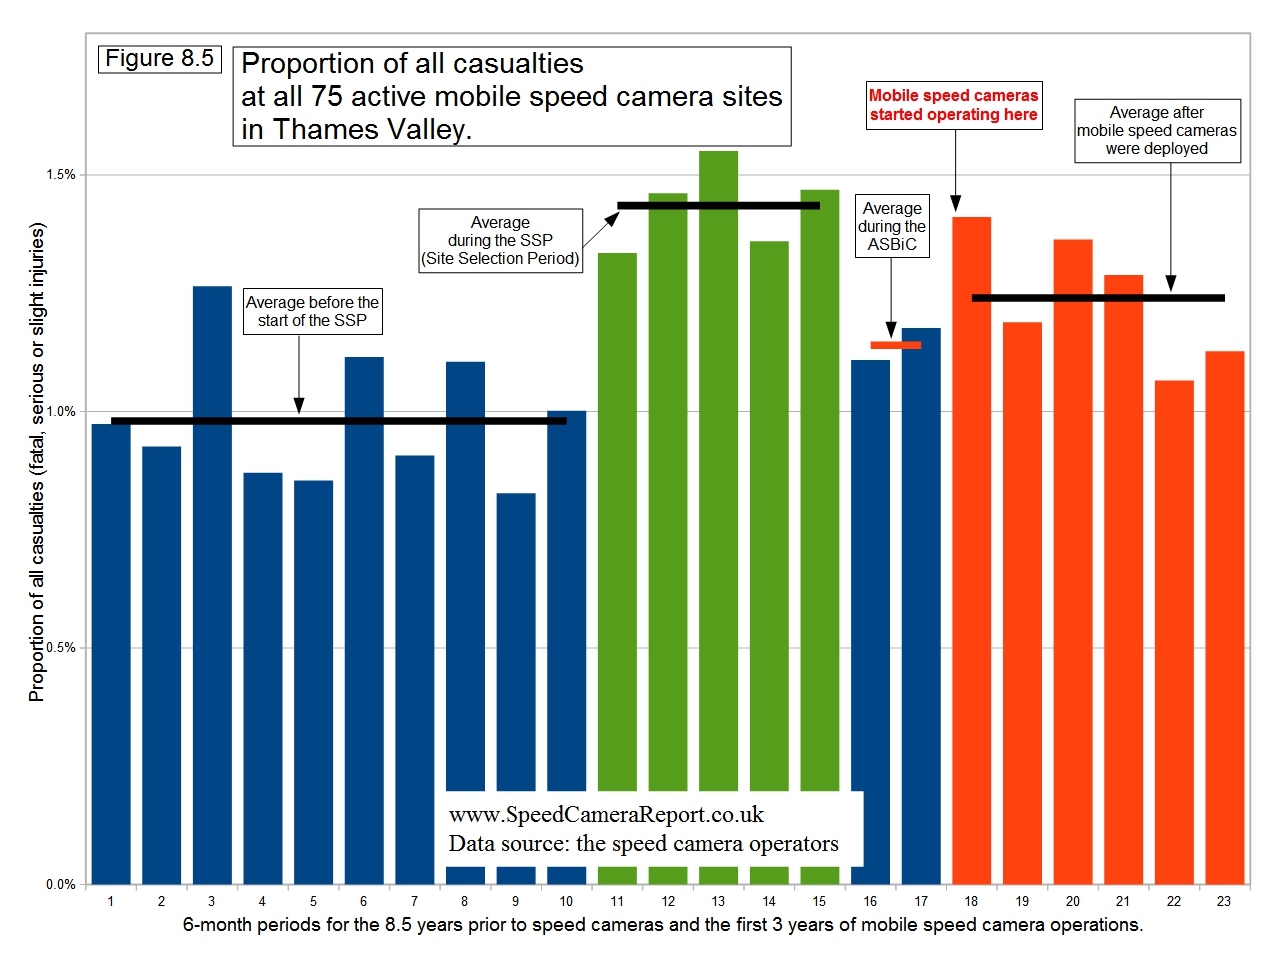
Figure 8.5 shows there was a difference in casualty rates during the PreSSP and ASBiC periods but, unlike fatalities, the total number of casualties at these sites was relatively high (more than 90 every six months). While fatalities are believed to be accurately recorded, the vast majority of casualties suffer slight injuries and the Police only record around a third of all those that occur (9). Changes in recorded numbers of casualties on relatively short stretches of road, such as these mobile speed camera sites, could therefore reflect local variations in Police reporting practices rather than changes in actual casualty rates. Whatever the reason, the mid-point of the PreSSP and ASBiC casualty rates may not accurately represent the mean rate prior to speed cameras therefore the rate just during the ASBiC is assessed to give the most reliable value for the mean casualty rate in Tables 8.2 and 8.3.
8.10 Results
The standard method used to assess the effects of speed cameras is to compare a period after they were deployed (typically the first 3 years) to a baseline period before (typically the 3 years used to select the sites). Table 8.1 shows results using this method at the 75 mobile speed camera sites in Thames Valley. There were significant reductions in all severities of collisions and casualties consistent with results in official reports that used this method. These results include the effects of RTM, general influences and the mobile speed cameras.
RTM is the change that occurred from the relative rates that led to the sites being selected (those during the SSP) to the relative mean rates (those outside the SSP) prior to speed cameras. Table 8.2 shows the changes that occurred due to RTM at the mobile speed camera sites in Thames Valley prior to speed cameras being deployed. RTM is found to have resulted in greater reductions in all severities of collisions and casualties prior to speed cameras than were found in Table 8.1 after mobile speed cameras were deployed, with the exception of all casualties.

Table 8.3 shows comparisons of before and after the deployment of mobile speed cameras and the relative mean rates of all severities of collisions and casualties were found to have increased. As these results do not include RTM effects and are also compensated for the effects of general influences, they should be about as accurate an evaluation of the effects of the mobile speed cameras as is possible given the data available.
Table 8.4 shows the numbers that would have occurred during the next three years had the relative mean rates remained unchanged and these are compared to the numbers that did occur after mobile speed cameras were deployed.
8.11 Acknowledgements, references and supplementary information
